
Many agents. Many models. One dashboard.
PI Dashboard is an open-source, self-hosted dashboard that mirrors running pi agent sessions in real time: on your laptop and your phone you can see which agent is working on what, what it costs, and where it got stuck.
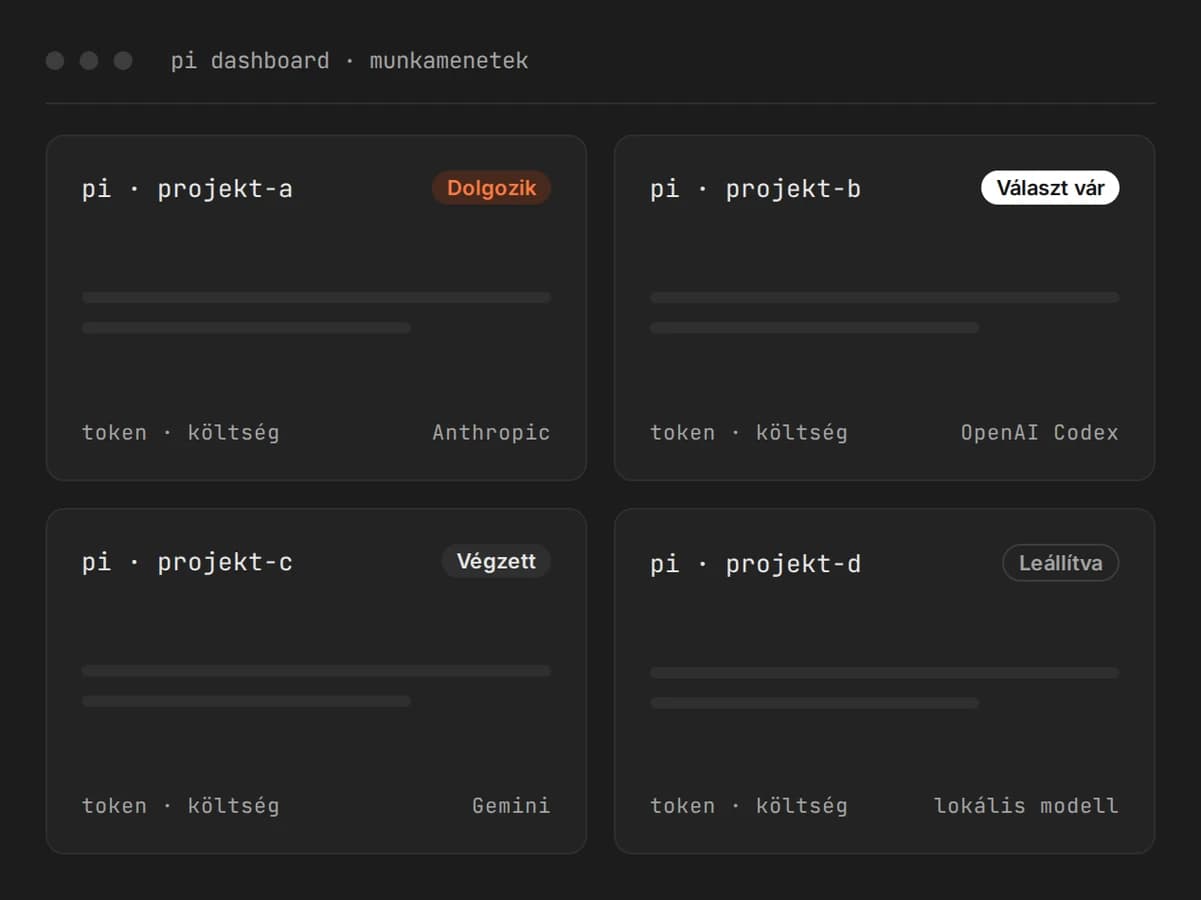

Track and control your AI coding agents from a single interface. The dashboard does more than observe: it starts sessions, runs several agents in parallel and sends finished work to review, while the code, API keys and logs stay on your own machine or server.
The cost of losing the overview
What gets lost when an agent works for hours?
Developers tied to the terminal
AI coding agents now work on a task not for minutes but for hours. Meanwhile, the developer waits for the result, tied to a single terminal window.
Lost overview
Anyone running agents on several tasks at once cannot see in one place what is running, what has finished, what is asking a question, and what it all cost.
Unmeasurable AI spend
If token and dollar spend is not visible per session, decision-makers cannot measure whether AI-assisted development pays off.
Why is the terminal not enough?
01 / Interface
One session at a time
A terminal interface can show one session at a time. There is no shared view of agents running in parallel.
02 / Access
Supervision tied to the desk
There was no tool that made agents' work trackable and controllable in real time, from a phone as well.
03 / Data
Code that must not leave the company
Where source code must not leave the company infrastructure, you need a tool that itself sends no data to external services.
The solution
Real-time Session Mirroring
Running pi sessions connect to the dashboard server, and each gets its own card. The conversation, reasoning steps, tool calls and costs arrive live in the browser. Control works both ways: you can send a prompt, answer the agent's question and stop the run, from a laptop or a phone.
Not a passive monitor: from the browser you can reply, send prompts and stop runs.
How does PI Dashboard work?
Installation
A ready-made desktop application for macOS, Linux and Windows, with no prerequisites; it ships with Node.js. It can also be installed as an npm package.
Connecting sessions
Running pi sessions connect to the dashboard, organised by project folder.
Live tracking
Conversation, reasoning steps, tool calls, token and cost counter, and context usage on one interface.
Intervention
Prompts, answers to the agent's questions, stopping, and switching models even mid-session.
Review and commit
Diff view, file tree and a separate worktree per change; review and commit without leaving the interface.
What can PI Dashboard do?
Sessions and cost
Sessions
Real-time mirroring, starting new sessions, browsing history, forced stop.
Statistics
Token and cost counter, model info, context usage, runtime.
Workspace
Organisation by project folder, pinned directories, drag-and-drop ordering.
Development and git
Developer tools
Built-in Monaco editor and terminal, diff view, file tree, open in VS Code or Cursor, Markdown, Mermaid and LaTeX rendering.
Git
Branch switching, a separate worktree per change, review and commit.
OpenSpec
Spec-driven development: proposal, plan, implementation, archiving.
Agents and models
PI-flows
Designing and running multi-agent workflows with a live flow graph and budget tracking.
Free choice of model
Anthropic, OpenAI Codex, GitHub Copilot, Gemini, Antigravity, as well as custom OpenAI- and Anthropic-compatible endpoints; the model can be switched mid-session, so sensitive tasks can be routed to a local model.
Automation
Sessions started on a schedule or on file changes, goals defined with success criteria.
Access and extension
Mobile
Responsive interface, QR code pairing, installable as a PWA.
Team sharing
Public URL via zrok tunnel, with OAuth and an allowlist.
Extensibility
Plugin system with ten UI slots, skills (review, debug, harden, estimate, release) and an MCP endpoint.
Data protection
Where do the code and prompts go?
PI Dashboard is self-hosted: source code, API keys and session logs stay on your own machine or server. The dashboard collects no telemetry and sends no data to any external service.
Outbound communication only happens if you choose an external, cloud-based LLM: in that case the content of the prompt is received by that model provider and is subject to its data processing terms. With a locally run model, no data leaves your organisation's network.
Your machine or server
- source code
- API keys
- session logs
- PI Dashboard
No telemetry, no data sent to external services.
- Only the prompt
Cloud LLM
Received by the chosen model provider, under its terms.
- Inside the network
Local model
No data leaves your organisation's network.
Who is PI Dashboard for?
Developers
Who use an AI coding agent every day and want to run it on several tasks at once.
Teams and tech leads
Who need to see what the agents are working on and review the finished work.
CTOs and decision-makers
For whom it matters that AI spend (tokens, USD) and return on investment are measurable.
Privacy-sensitive organisations
Where source code must not leave the company infrastructure; with a local model, the entire workflow stays inside the network.
Software houses and integrators
Who run client projects in parallel, with a separate folder and branch per project.
Two ways to install
Desktop application
A ready-made installer for macOS, Linux and Windows, with no prerequisites; it ships with Node.js.
- macOS
- Linux
- Windows
npm package
Installable from the command line with a single line.
npm install -g @blackbelt-technology/pi-agent-dashboard
Control your AI agents from one place!
Request a demo, and let's look together at how PI Dashboard fits into your team's development workflow.
Contact us
- Phone:
- +36 1 611 0462
- Email:
- info@blackbelt.hu